
Solution_08 / SEO Portal
SEO Portal – search engine optimisation you can actually see
Don’t learn what happened to your website from a monthly PDF.
Most companies only see SEO as a monthly report full of charts that never says what to do differently. In the SEO Portal you see your Google Search Console and Google Analytics data, our own cookieless visitor tracking and our expert SEO audits in one place – in plain language, and always together with what to do next and how much it could bring.
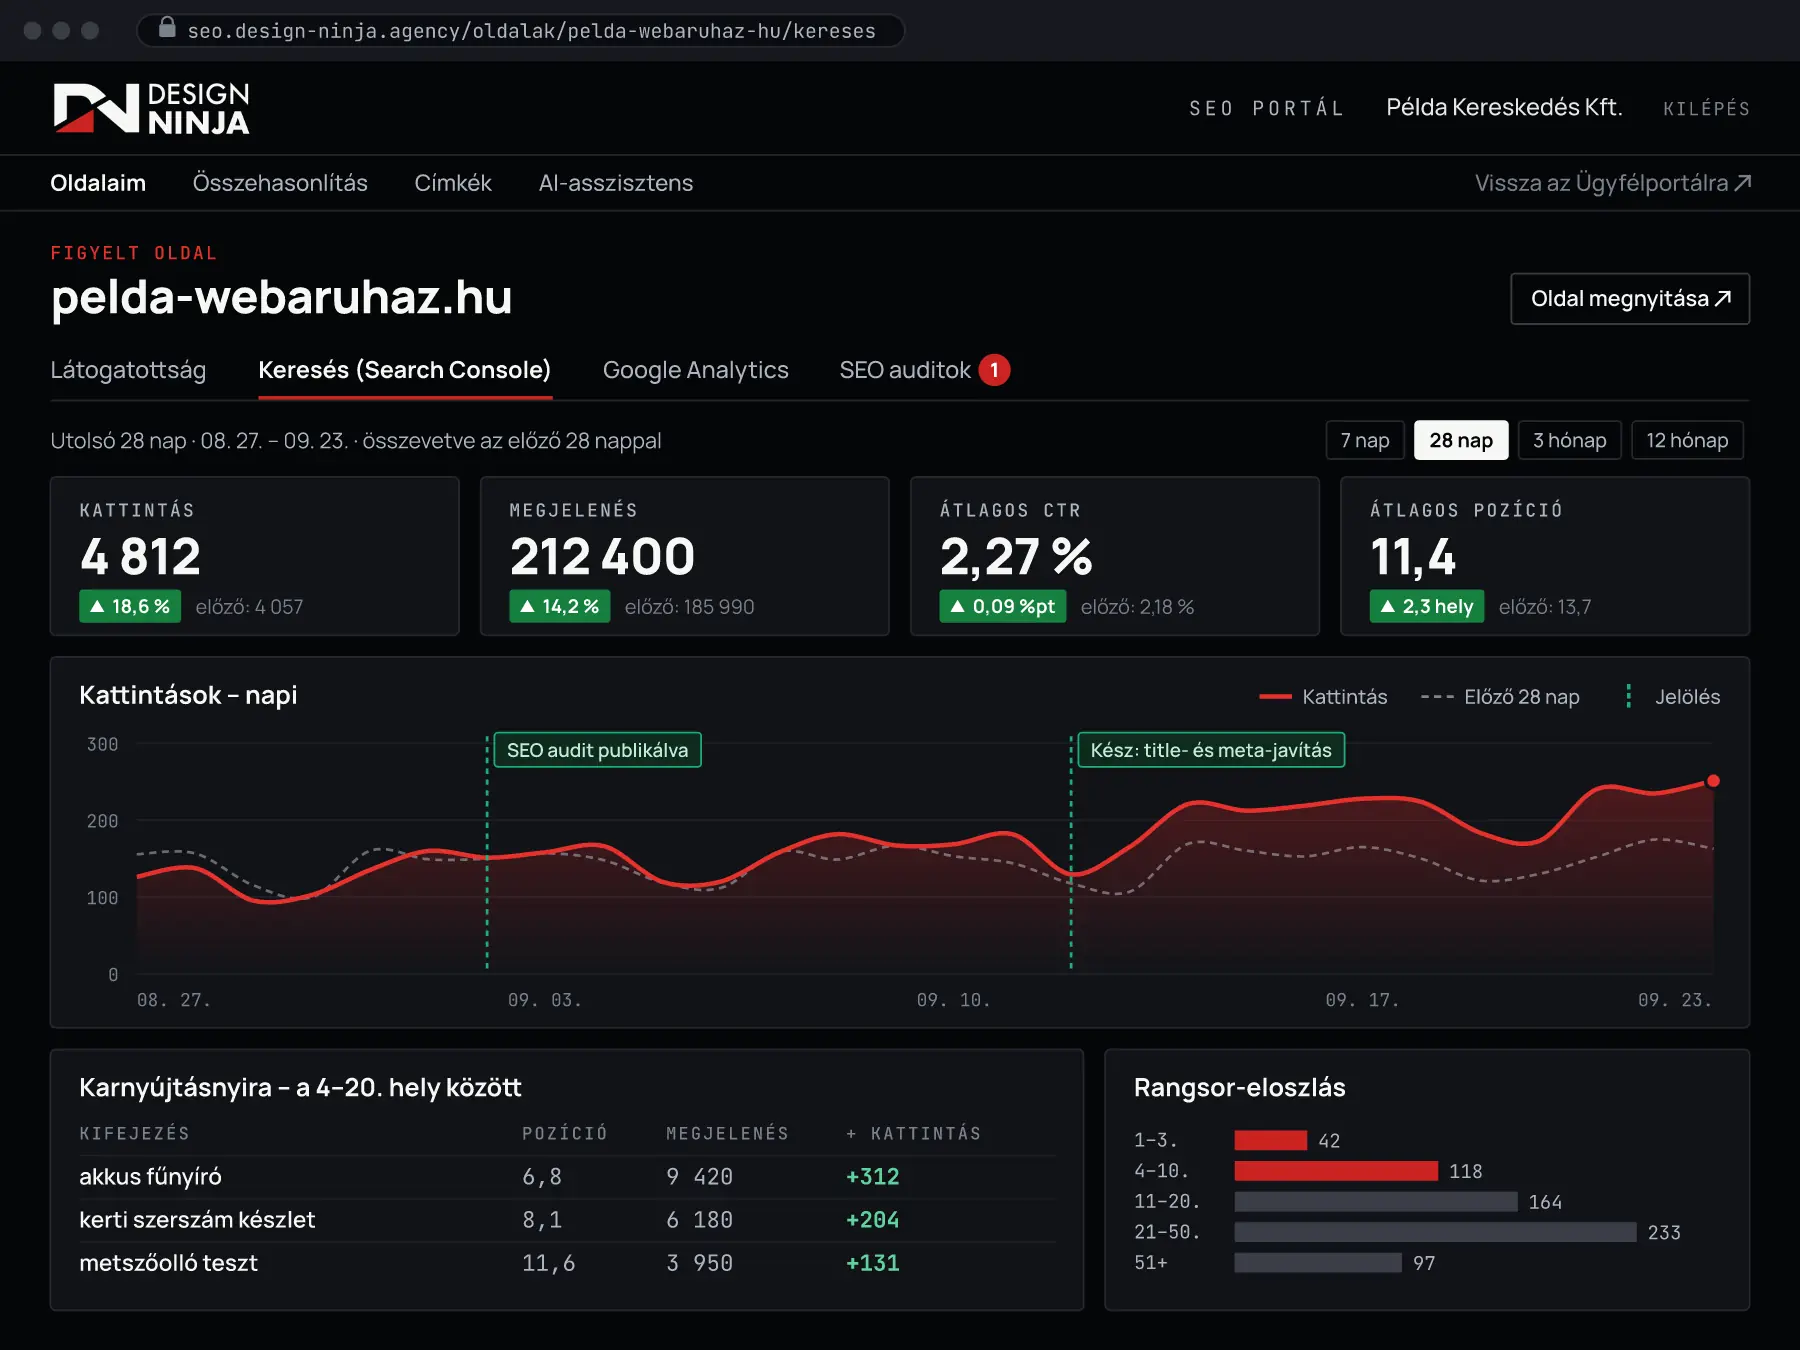
- Search Console
- Google Analytics 4
- Cookieless tracking
- SEO audit with action plan
- Keyword opportunities
- Multi-site comparison
- AI assistant
- Hungarian interface
The gist
Data → to-do → done → visible result. One interface.
01 / Who it’s for
Who is the SEO Portal for?
-
01
Businesses for whom Google is the main source of customers
Webshop, service provider, accommodation: if most of your new enquiries come from search, it matters whether you rank 4th or 11th. Here you see exactly where you stand and what would bring more clicks.
-
02
Those who pay for SEO but can’t see what they get for it
Every piece of work is placed on the chart with its date – you can see when something happened and what changed afterwards. No “just trust us”, only your own numbers.
-
03
Those who run several websites
Webshop, blog, service site or multiple brands: grouped with tags, compared on a single chart, with a single login.
-
04
Those who don’t want to become SEO experts
You don’t need to know every menu in Search Console. The portal calculates the opportunities, ranks the to-dos and explains under every chart what you are looking at.
02 / What it does
Five views that lead to decisions – not just charts.
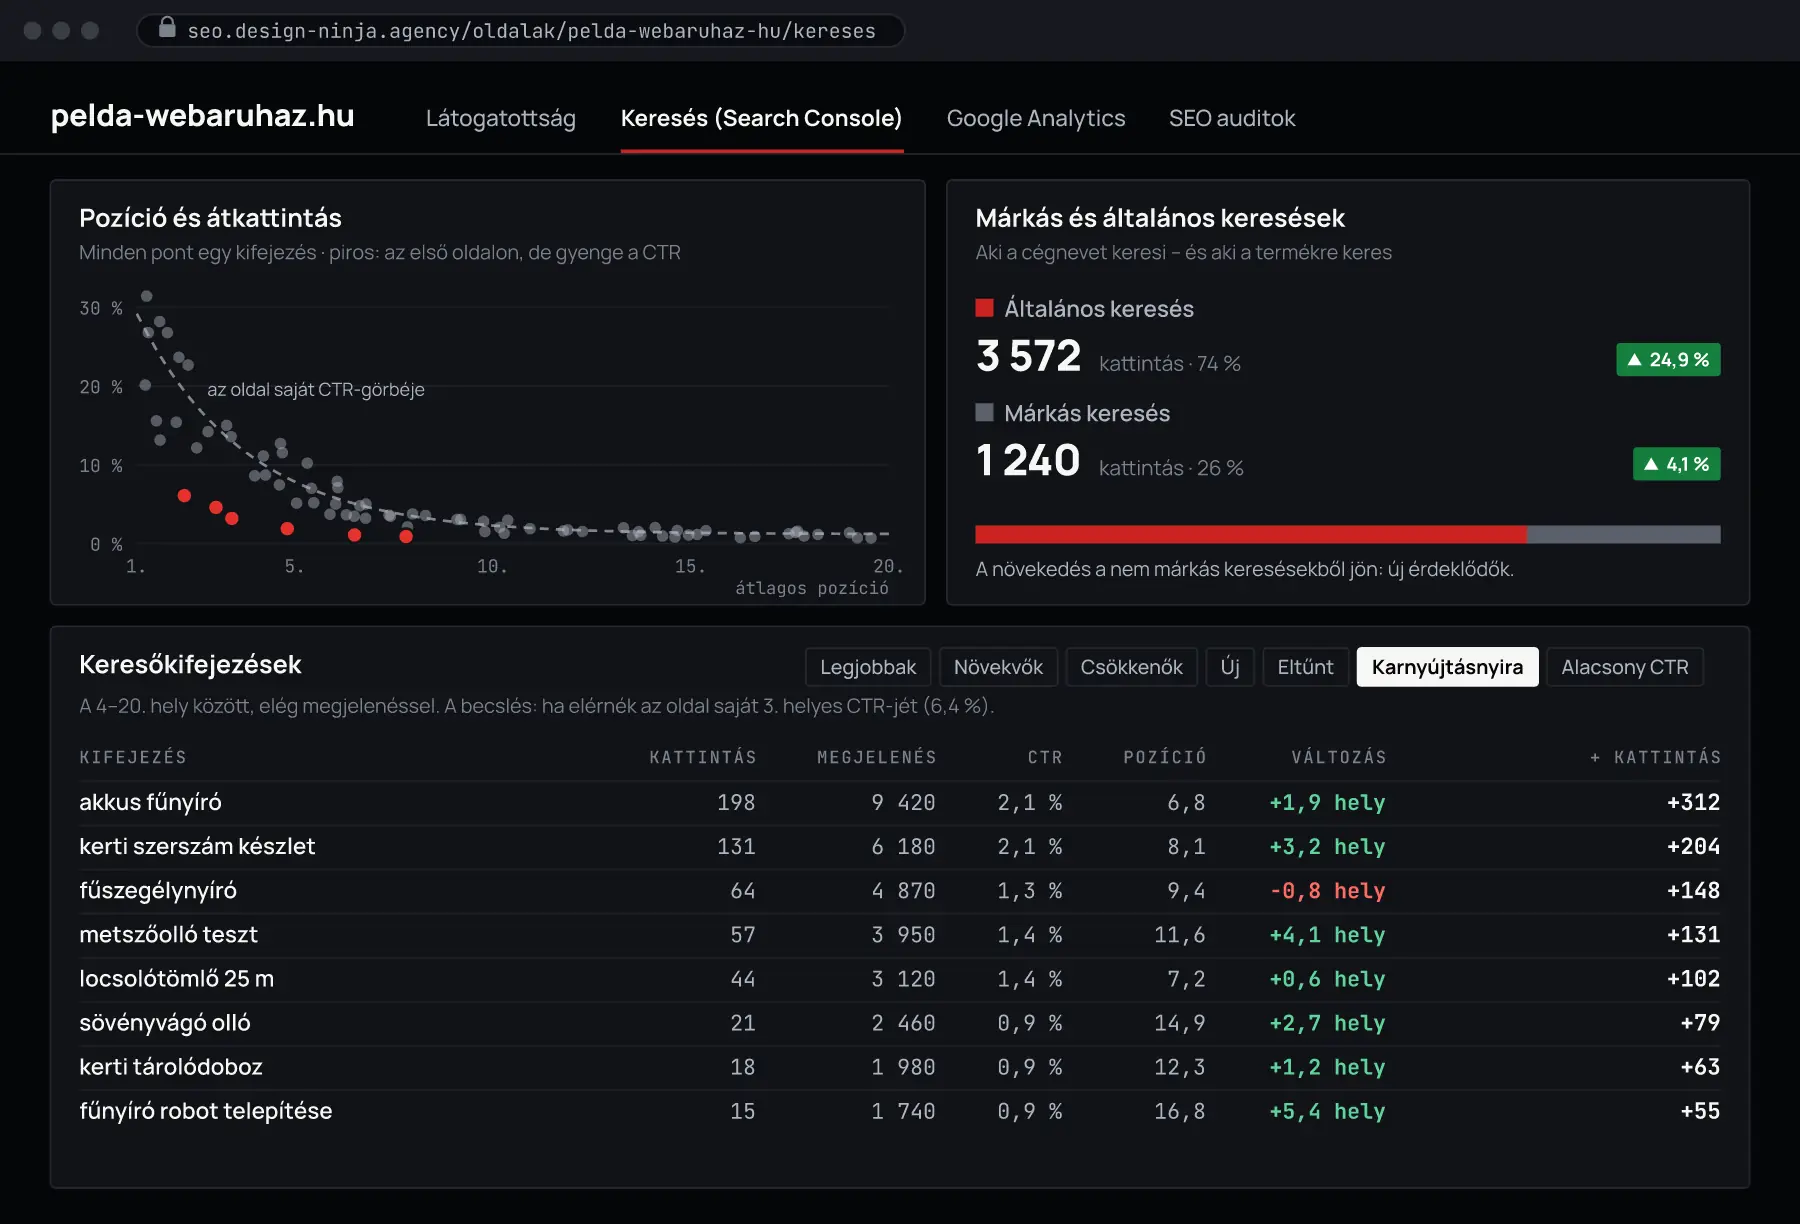
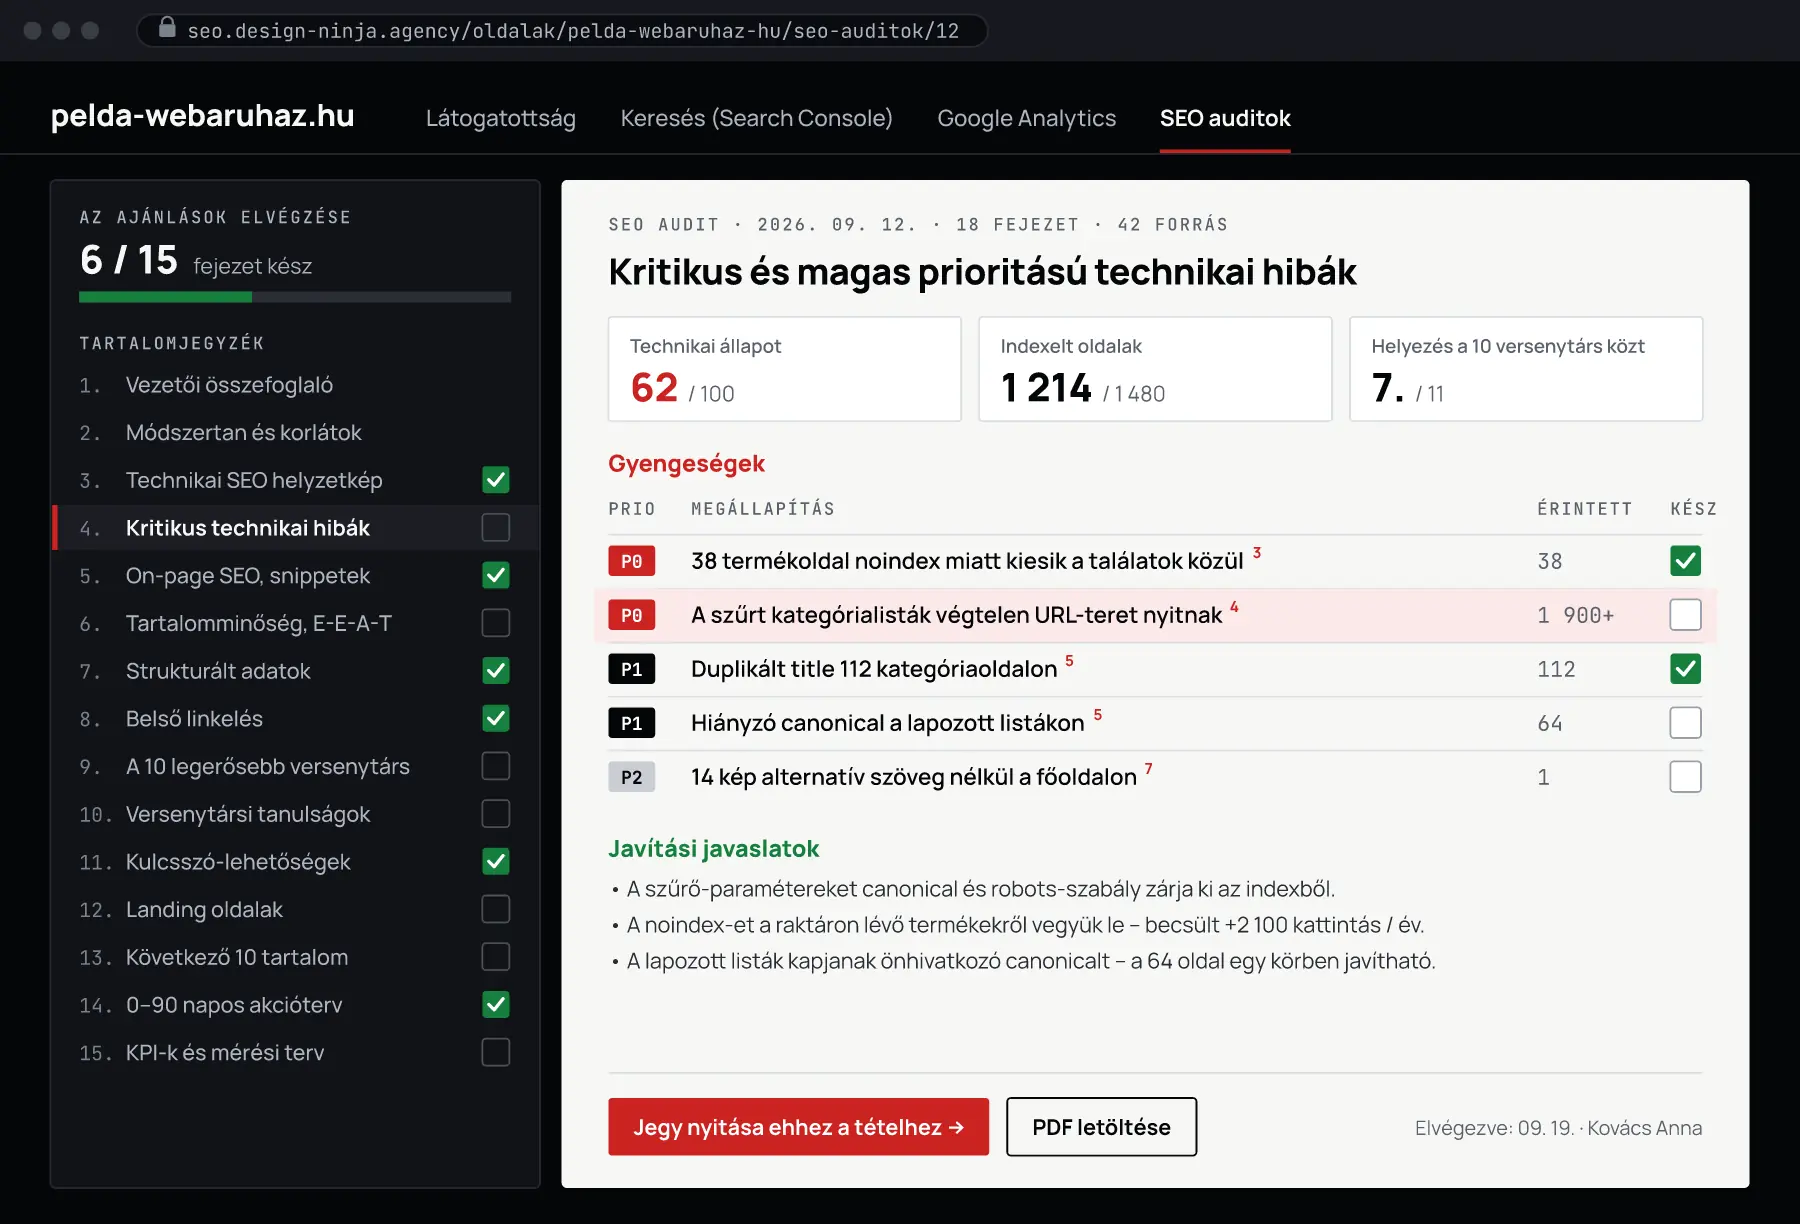
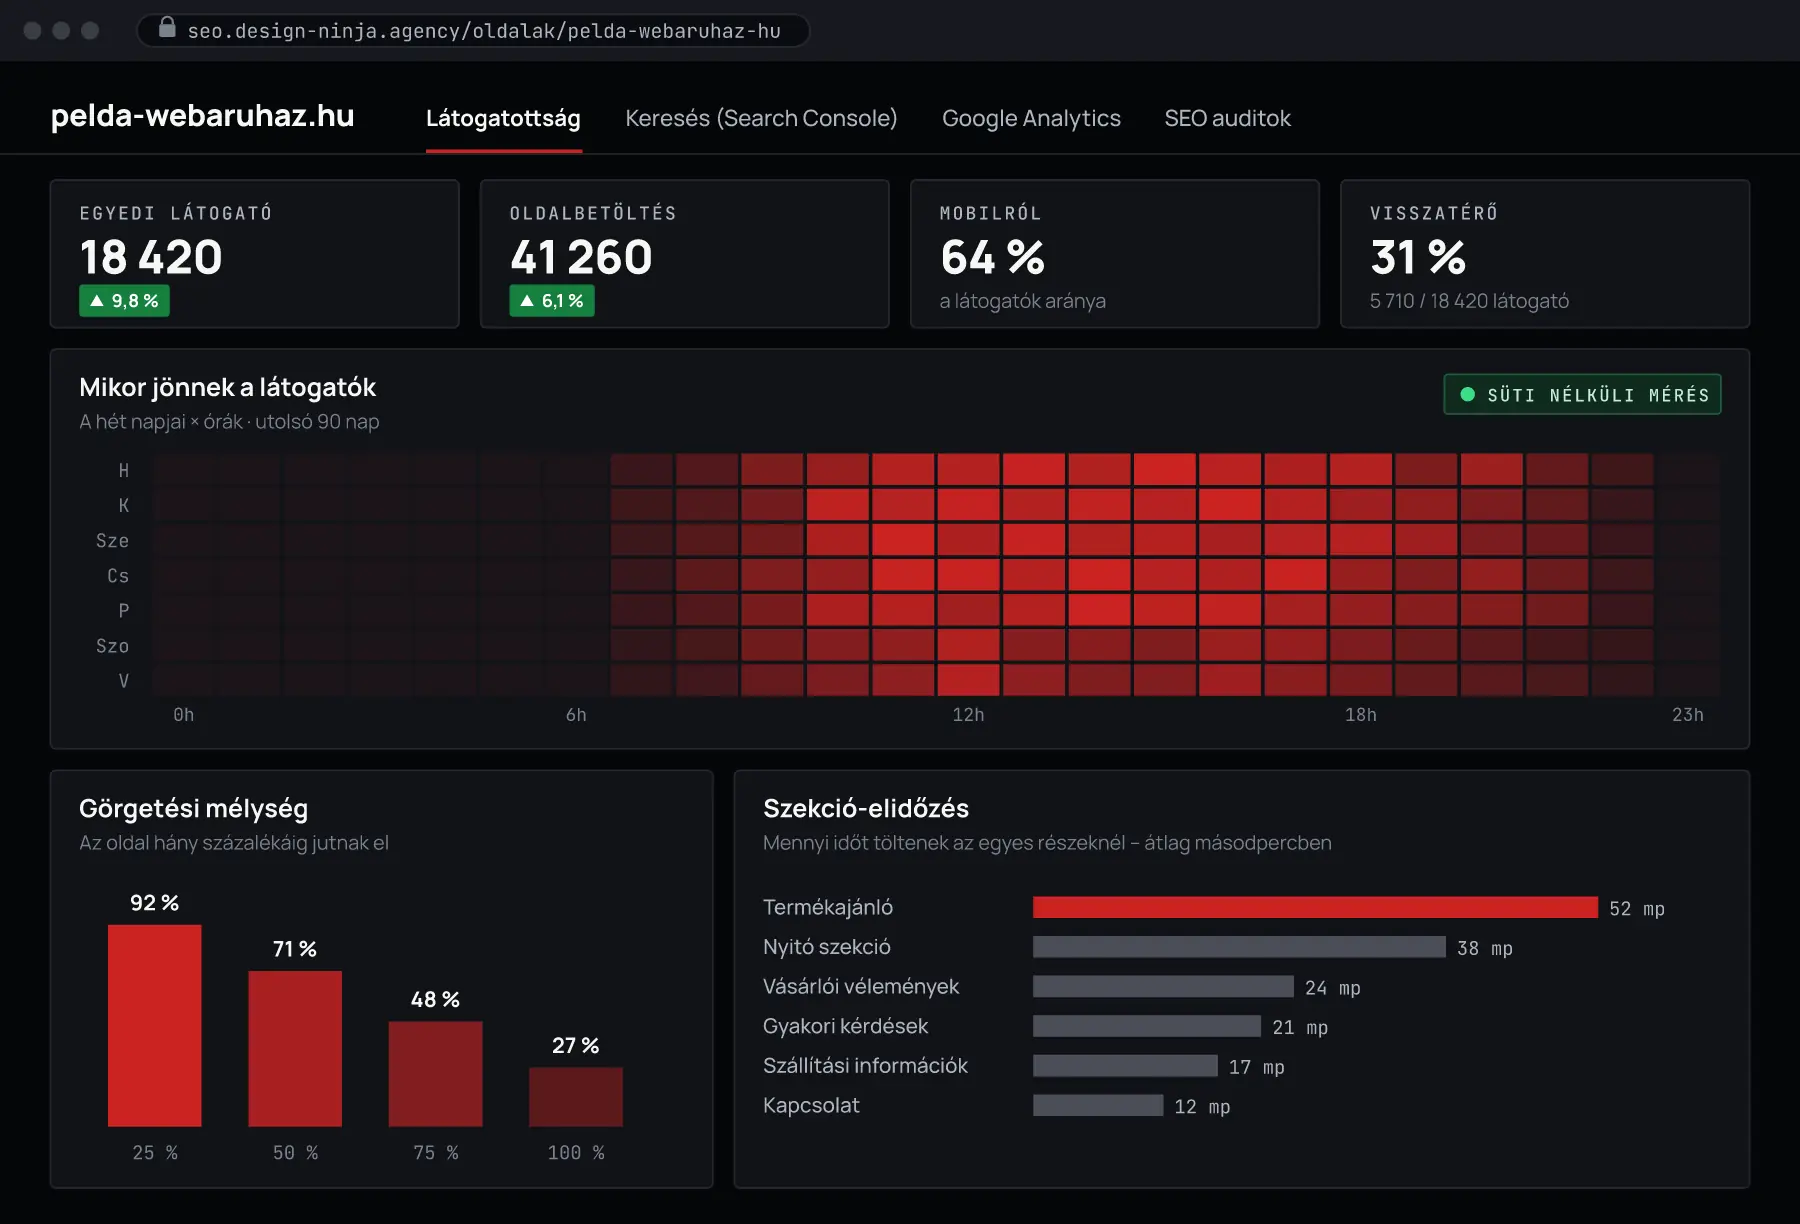
The images show the SEO Portal interface (in Hungarian) with made-up sample data. Click any image to enlarge it.
01
Search: more clicks where you already rank
Your Search Console data isn’t a raw table but organised: clicks, impressions, click-through rate and average position, compared with the previous period and with the same period a year earlier. The portal also calculates the most valuable part: which queries rank between positions 4 and 20 with enough impressions – and how many extra clicks they would bring if they moved up. The estimate is based on your own site’s data, not on made-up industry averages.
- Also as a total: how many extra clicks can be won across the whole list
- An estimate, a recommendation and the ranking pages for every row
- Low click-through and declining queries – with the likely cause
- Cannibalisation, branded and generic searches shown separately
02
An SEO audit that doesn’t end up in a drawer
We don’t send our audits as a PDF to be forgotten. In the portal you get a readable, searchable report in 18 chapters – technical health, content, internal links, a comparison with the 10 strongest organic competitors, a 90-day action plan – with a source and a P0–P3 priority for every finding. You tick off finished to-dos, and the tick automatically appears as a marker on the chart, so you can later see which fix brought what.
- Progress tracked by chapter and item – the number of open to-dos is also shown in the page header
- A source next to every claim – verifiable, not “because we say so”
- “Open a ticket”: a pre-filled ticket in a pop-up, without leaving the audit
- Email notification when a new audit arrives; PDF download if you need it
03
Our own cookieless tracking – you see the visitors Google doesn’t
Google Analytics only measures visitors who say yes in the cookie banner – on many sites that is less than half of the traffic. Our own tracking runs without cookies on our own server, doesn’t store IP addresses and filters out bots, so it shows the full traffic: where visitors come from, what they read, when they arrive and how far they scroll. The portal also shows what share of real traffic GA4 can see.
- Share and change of visitors from search, source, country, device, landing pages
- When they come: a day × hour heatmap
- Section dwell time and scroll depth – which part works
- Rising and declining content, returning visitors
04
Several sites, one chart
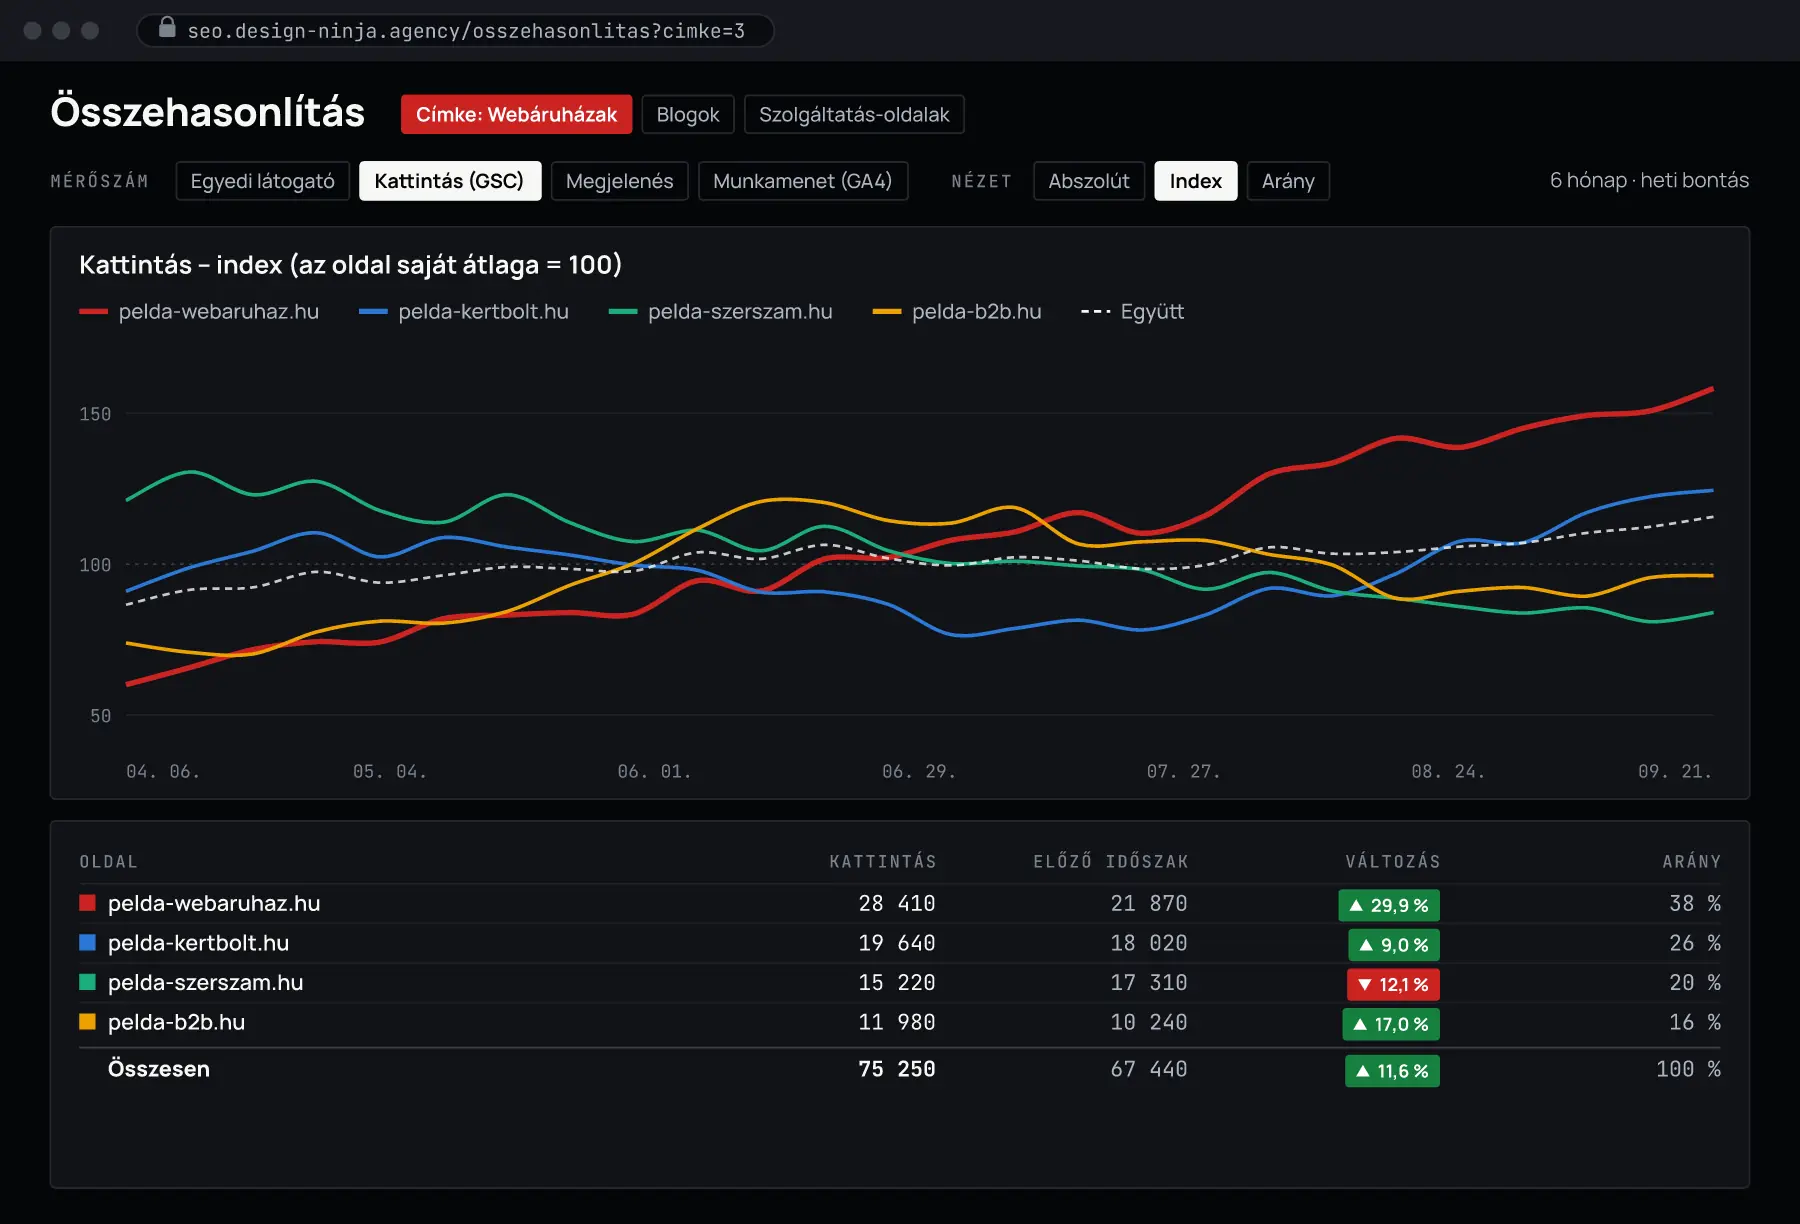
If you have more than one website, the question isn’t just “is traffic growing?” but which site is pulling ahead and which is falling behind. In the Comparison view you put up to seven sites on one chart – by own tracking, Search Console or Analytics – and switch between real numbers, an index (the site’s own average = 100) and a ratio view. You group sites with tags, so comparing “Webshops” or “Blogs” takes one click.
- Absolute, index and ratio views
- The previous period faintly in the background, with the group’s combined curve
- Summary table with change and ratio
- Colours that are easy to tell apart, also for colour-blind users
05
Ask about your data – from your own AI assistant
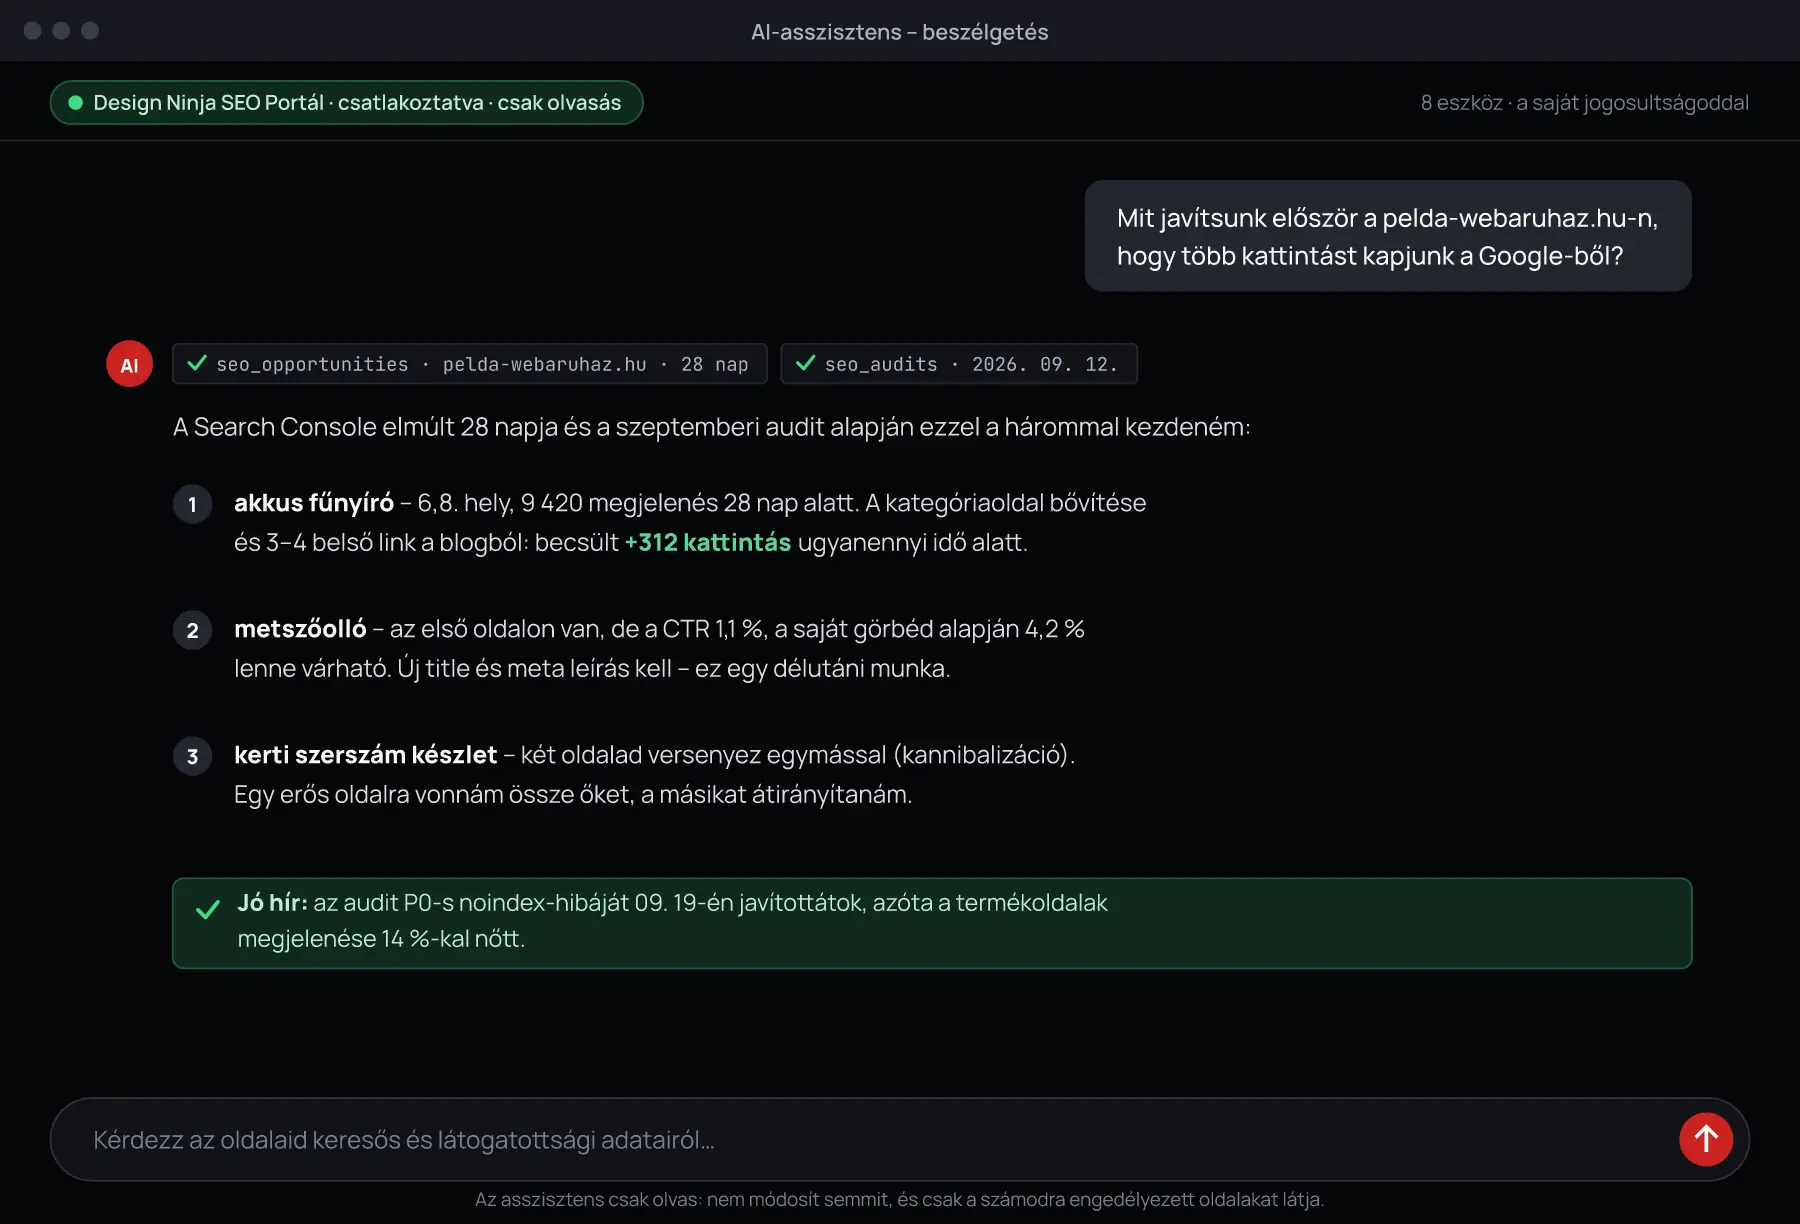
You don’t have to browse charts when you have a specific question. Connected to ChatGPT or Claude, you can simply ask: “what should we fix first?”, “why did traffic drop in March?”, “what did the audit say about internal links?”. The assistant answers from the portal’s data – it only reads, changes nothing, and only sees the sites you have access to.
- Search Console, Analytics, own tracking and audits in one conversation
- Ready-made to-do lists from the portal’s calculations
- Read-only, with your own permissions; every query is logged
- Switched on separately, per company and per colleague
03 / What else is in it
The small things that make you actually use it.
-
01
Google Analytics 4, explained
Channels, source/medium, devices, new and returning visitors, day and hour breakdowns, events – with explanations, instead of hunting through the GA4 menu maze.
-
02
Markers on the chart
Audit published, to-do completed, campaign, new page launched: every important event is a marker on the chart, so cause and effect appear side by side.
-
03
Colleagues with their own permissions
You decide who sees what: access that can be limited per site, permissions that can be switched on per feature, an invitation by email, and one account that also works for the Client Portal.
-
04
Always fresh data
Our own tracking and the Google data are refreshed every hour. Search Console lags 2–3 days on Google’s side – the portal flags this and aligns the periods to the last day with data.
-
05
What changed since you last looked?
A new audit is marked in red and you also get an email about it; in the page header you always see how many to-dos are still open.
-
06
Read-only access to your Google account
The connection asks for read-only access to Search Console and Analytics. The portal changes nothing, and you can disconnect at any time.
04 / How it starts
Four steps to your first login – and beyond.
You don’t need to install anything. We do the connection and setup; at the end you just receive an invitation email.
-
01
Demo
We show you the portal and decide together which of your websites to follow and who gets access.
-
02
Connection
You connect your Google account (or give access to our service account), and we set up the sites and permissions. If your site was built or runs with us, we also switch on our own tracking.
-
03
First SEO audit
Our own crawl, a comparison with the 10 strongest organic competitors, a 90-day action plan – readable in the portal, downloadable as a PDF.
-
04
Working together
You tick off what is done, leave to us what you won’t take on – and the chart shows which step brought what.
05 / What makes it different
How is it different from a monthly SEO report?
-
01
Not once a month, but whenever you look
The data is refreshed every hour. If a question comes up on Tuesday, you get the answer on Tuesday – not at the end of the month.
-
02
Not a chart, but a to-do
The opportunity lists tell you which query and which page holds the most winnable clicks – and how many. The order is decided by your data.
-
03
Not our word, but your numbers
Every audit finding comes with its source, and every piece of work is marked on the chart. You can verify what we did and what it brought.
-
04
Not for experts, but for you
A Hungarian-language interface, a clear explanation under every chart. SEO expertise is our job – the decisions are yours.
06 / Frequently asked questions
What most people ask.
No. The Search Console and Analytics reports, the SEO audit, the comparison and the AI assistant work with any website – WordPress, a webshop engine or a custom system. Our own cookieless visitor tracking is available on sites we built or run.
The portal only asks for read-only access to Search Console and Google Analytics – it changes nothing and only uses the properties that belong to your monitored sites. The connection can be disconnected at any time.
Our own tracking uses no cookies, runs on our own server, doesn’t store IP addresses and doesn’t link visitors across sites. That’s why it also sees those who say no in the cookie banner – GA4 doesn’t measure them. Together the two give the full picture, and the portal puts them side by side.
Our own tracking and the Google data are refreshed every hour. Search Console data lags 2–3 days on Google’s side, so the reports always run to the last available day – the portal flags this.
From ChatGPT or Claude you can ask about your sites’ data: search, traffic, audits, to-do lists. The assistant only reads, only sees the sites you are permitted to see, and every query is logged. We switch it on separately per company and per colleague.
We put the quote together based on the number of monitored sites and the services you want – regular audits, SEO work. After the demo we give you a quote with no obligation.
At seo.design-ninja.agency, with the same account you use for the Client Portal. If the SEO Portal doesn’t appear for you, write to us and we’ll switch it on.
Related solutions
Next step
Let’s see together what your site would show
Tell us which website (or websites) it is about. In a short online demo we show you the portal and look at where you could win the most clicks – with no obligation. If you are already our client, you can reach the portal at seo.design-ninja.agency.
-
Phone
+36 70 670 6670 -
Email
info@design-ninja.agency
Thank you, your message has arrived!
A colleague will get back to you shortly using one of the contact details you provided.